In our year end Stats Outline Report, we analyze the full year TRREB stats results and provide our outlook on what 2023 may have in store for the real estate and mortgage markets.
In section 1 of the report, we provide details analysis and commentary on the progression of average price and sales from 2020 to 2022. We organize our analysis into the following categories:
2020 – Uncertainty
2021 – Hyper Growth
2022 – Part 1 – The Peak
2022 – Part 2 – The Ride Down
2022 – Part 3 – Steady as She Goes
In section 2 of the report, we analyze the supply metrics for detached and condo property types heading into 2023 and outline key trends and issues that we expect will have the biggest impact on housing during 2023.
Section 1: 2020 to 2022 Average Price & Sales History
Section 1: 2020 to 2022 Average Price & Sales History
In Section 1 of this report, we provide an in-depth analysis and examine the progression of the market from 2020 to 2022.
We organize our analysis into the following categories:
2020 – The Year of Uncertainty
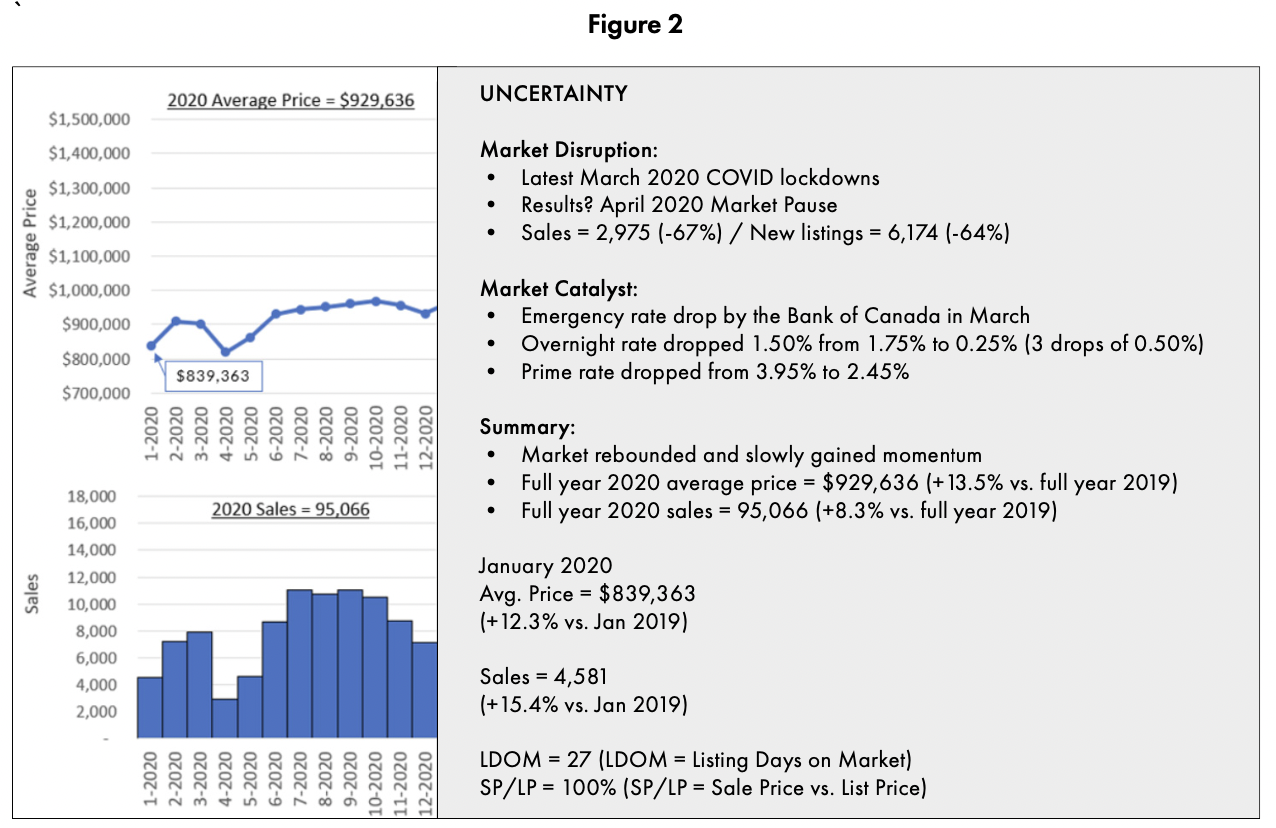
If we look back at 2020, one word comes to mind...”uncertainty”. January 2020 started strong with TRREB average price coming in at $839,363 for the month (+12.3% vs. January 2019). The positive news was cut short as COVID lockdowns took hold in the second half of March 2020.
How did the market respond? A complete market pause – as illustrated in the below chart (Exhibit #2), April 2020 sales dropped below 3,000 hitting 2,975 for the month (-67% year-over-year) and new listings fell by -64% year-over-year.
What many people don’t remember is that the Bank of Canada (BoC) implemented several emergency measures in March 2020 that, in hindsight, caused ripple effects that we are still feeling in 2023. The BoC dropped their overnight rate 3 times in March 2020 totalling a 1.5% reduction. This resulted in banks/ lenders reducing their prime rate from 3.95% down to an ultra low 2.45% (which remained in place until the Bank of Canada started raising rates in March 2022).
How did the market respond? After a few volatile months, the market gained its footing and posted strong results for the year (the exception was condos that experienced a significant growth in active listings from June to December 2020 given buyers’ preference for low rise property types during the COVID lockdowns). 2020 full year average price came in at $929,636 (up 13.5% vs. full year 2019), and 2020 full year sales came in at 95,066 (+8.3% vs. full year 2019).
2021 – Hyper Growth
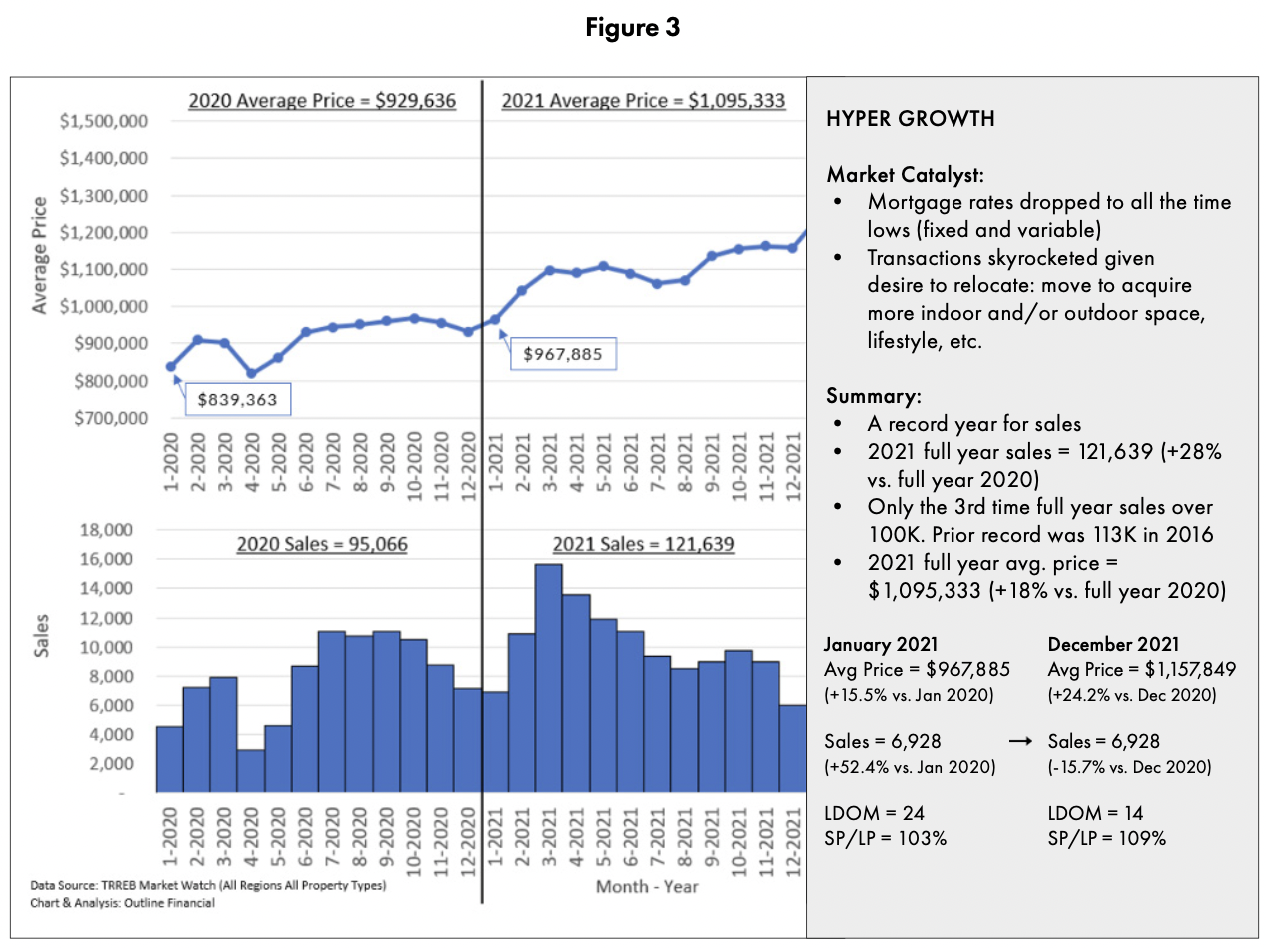
Strong 2020 results set the stage for a record-breaking 2021 which can be best described as the year of “Hyper Growth”.
With mortgage rates dropping to all-time lows across both fixed and variable rate products, the number of transactions skyrocketed as new buyers entered the market, and existing owners looked to buy/sell to gain more indoor space, outdoor space, or for a host of other reasons during the pandemic.
When the final numbers came in, 2021 posted a record number of sales, hitting 121,639 for the year (+28% vs. full year 2020). It was only the third time TRREB sales surpassed 100,000 and broke the previous record of 113K set in 2016 as shows in the below chart (Exhibit #3).
2022 – Part 1 – The Peak
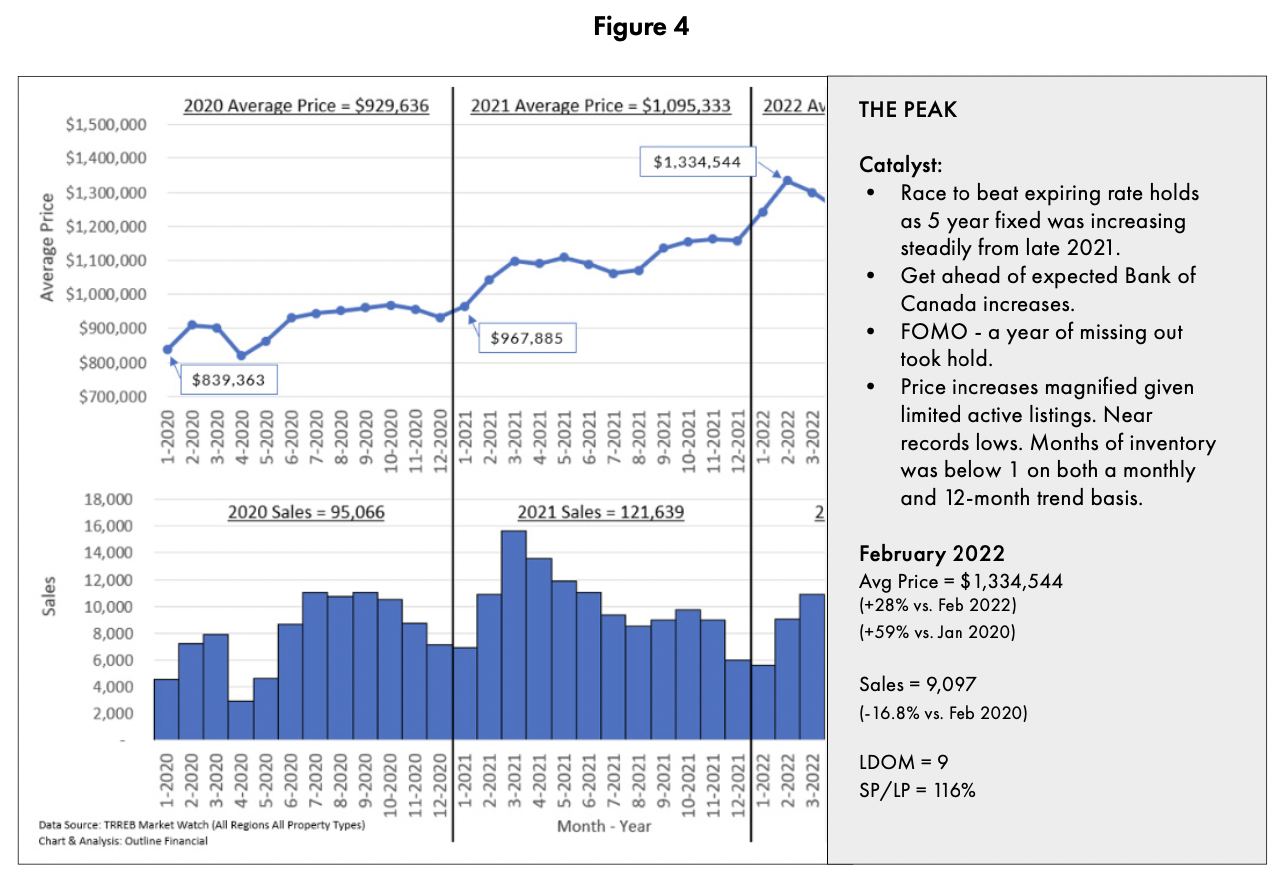
The hyper growth from 2021 carried through to 2022 with average prices hitting a peak of $1,334,544 in February 2022. This was a 28% increase over February 2022 and a whopping 59% increase versus January 2020.From the below chart (Figure 4) you can see that average price even accelerated during the period. We believe this acceleration was primarily driven by three reasons:
- Buyers trying to beat their expiring rate holds as 5-year fixed rates started to climb in mid to late 2021.
- Buyers trying to get in the market ahead of potential Bank of Canada rate increases.
- Supply / demand imbalance – with demand climbing, supply was near record lows with months of inventory below 1, days on market sitting at 9 days, and sale price to list price climbing to 116%.
2022 – Part 2 – The Ride Down
What goes up...
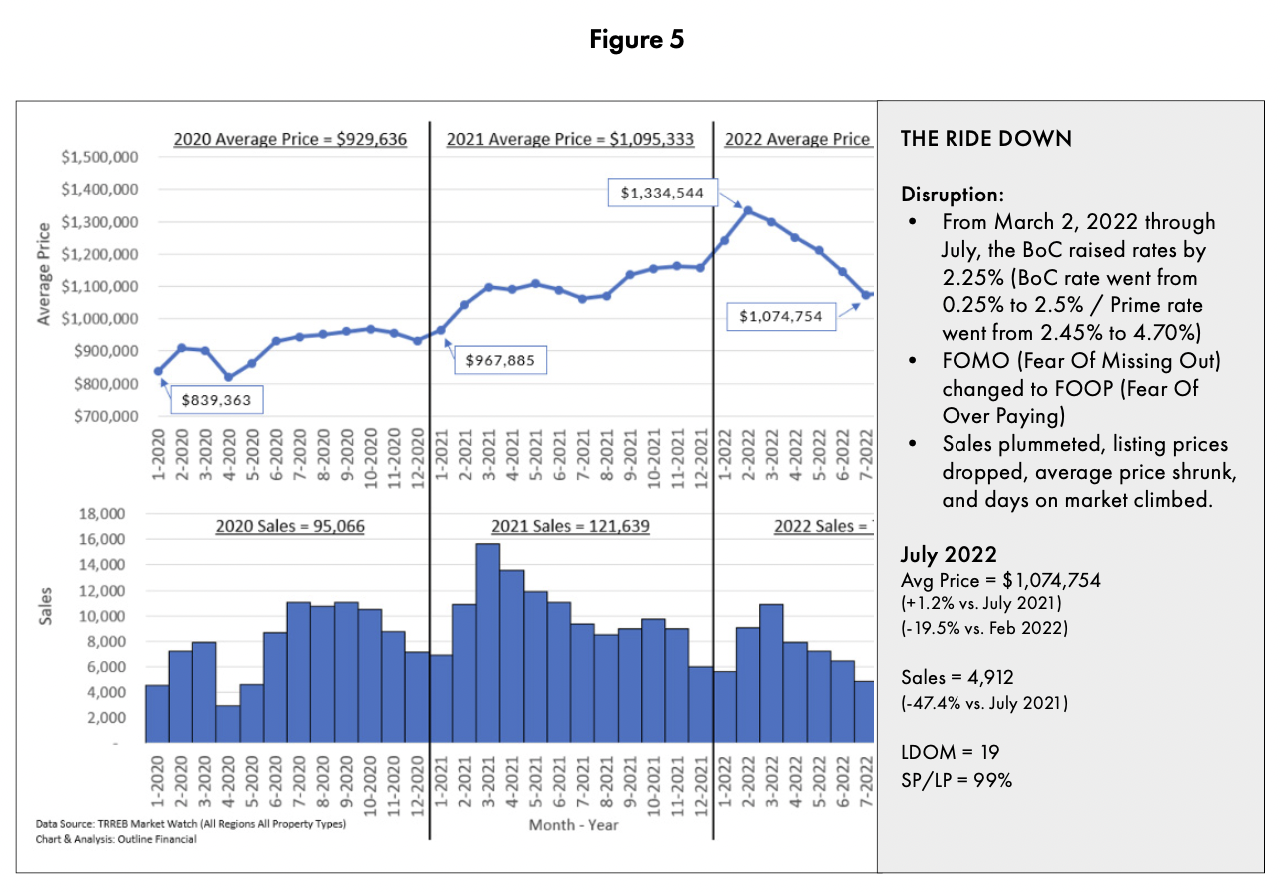
On March 2nd, 2022 the Bank of Canada started raising rates. From March 2022 through July 2022, the Bank of Canada raised by a total of 2.25% percent bringing their overnight rate from 0.25% to 2.50% (lender/bank prime rate went from 2.45% to 4.70%).
Suddenly, FOMO turned to FOOP, as buyers transitioned from a Fear Of Missing Out to a Fear Of Over Paying. Sales plummeted, listing prices dropped, average prices shrunk and days on Market climbed.
With respect to a percentage drop, average price dropped by -19.5% from February 2022 to July 2022 as illustrated in the below chart (Figure 5).
2022 – Part 3 – Steady as She Goes
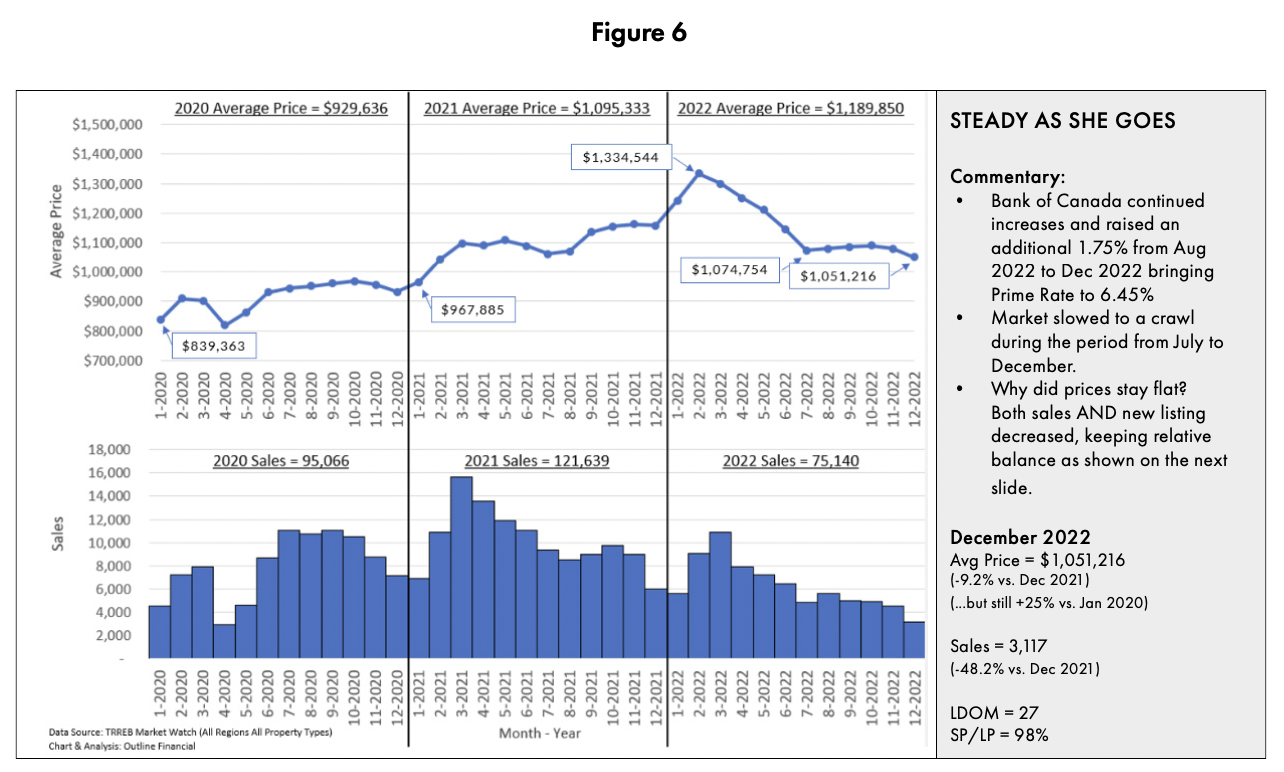
The next phase the market took a lot of people by surprise. From an average price perspective, after the steep decline in early 2022, prices levelled off in Jul 2022 ($1,073,754) and remained relatively flat through Dec 2022 ($1,051,216). This was despite a further 1.75% of rate increases by the Bank of Canada between Aug 2022 to Dec 2022 bringing prime rate up to 6.45% by the end of the year.
Unlike average price, sales continued to plummet through most of 2022. As illustrated in the below chart (Figure 6), sales slowed to a crawl from Jul 2022 to Dec 2022 averaging close to 5,000 sales per month over the period.
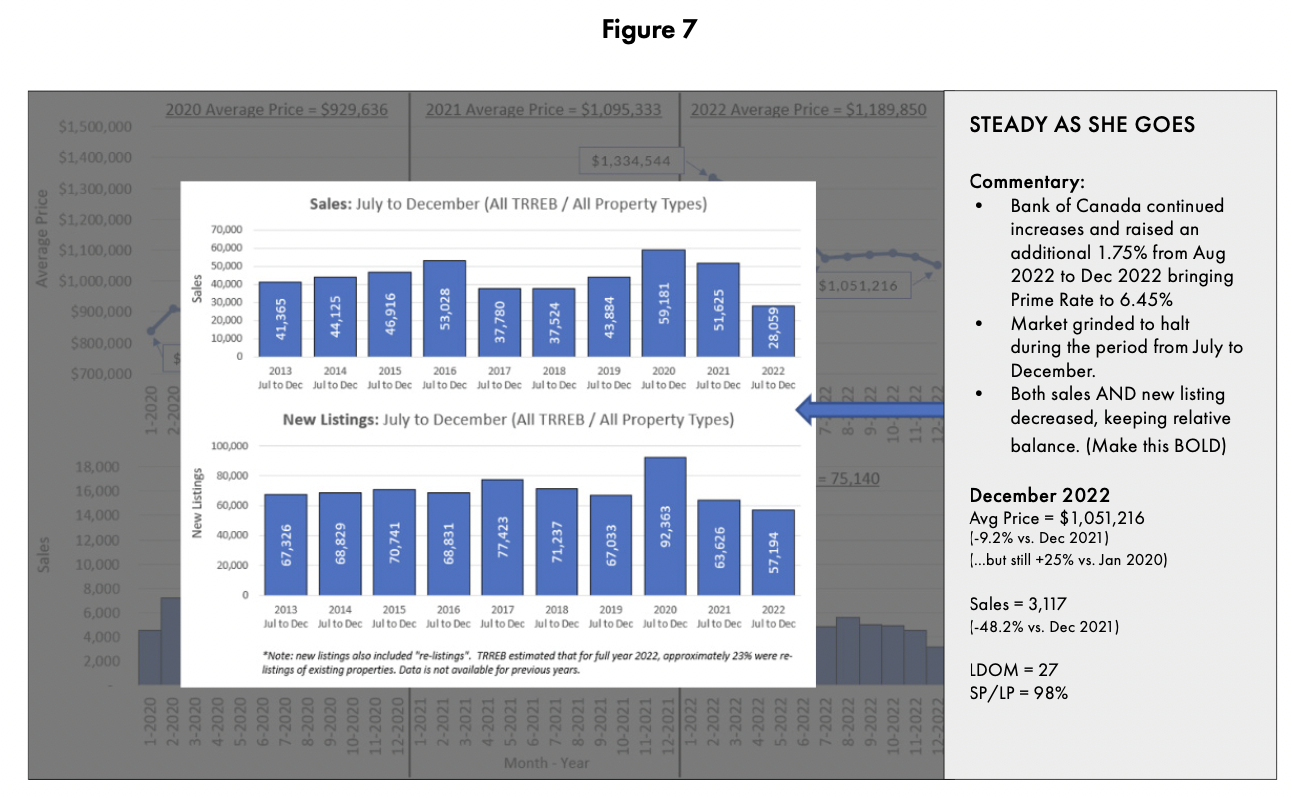
So why did sales plummet, but average price remain relatively flat from Jul to Dec 2022? As illustrated in the below chart (Figure 7), not only did sales post a 10-year low from July 2022 to December 2022 (28,059 sales), but new listings also posted a record low for the period (57,194 new listings) keeping supply/demand in relative balance.
Another point to consider, is the true new listings count was likely much less than the headline number during the Jul 2022 to Dec 2022 period. TRREB started publishing a new statistic in 2022 that tracked the percentage of relistings that were included in the new listings number. They estimate that for all of 2022, approximately 23% of new listings were actually re-listings of the same property (i.e., it was taken off the market then put back on).
Section 2: 2023 Outlook and Macro Trends to Watch
Section 2: 2023 Outlook and Macro Trends to Watch
In Section 2, we analyze the supply metrics for detached and condo property types heading into 2023 and review the macro level trends and issues that will have a big impact on housing in 2023.
Detached Supply – Active Listings Heading Into 2023
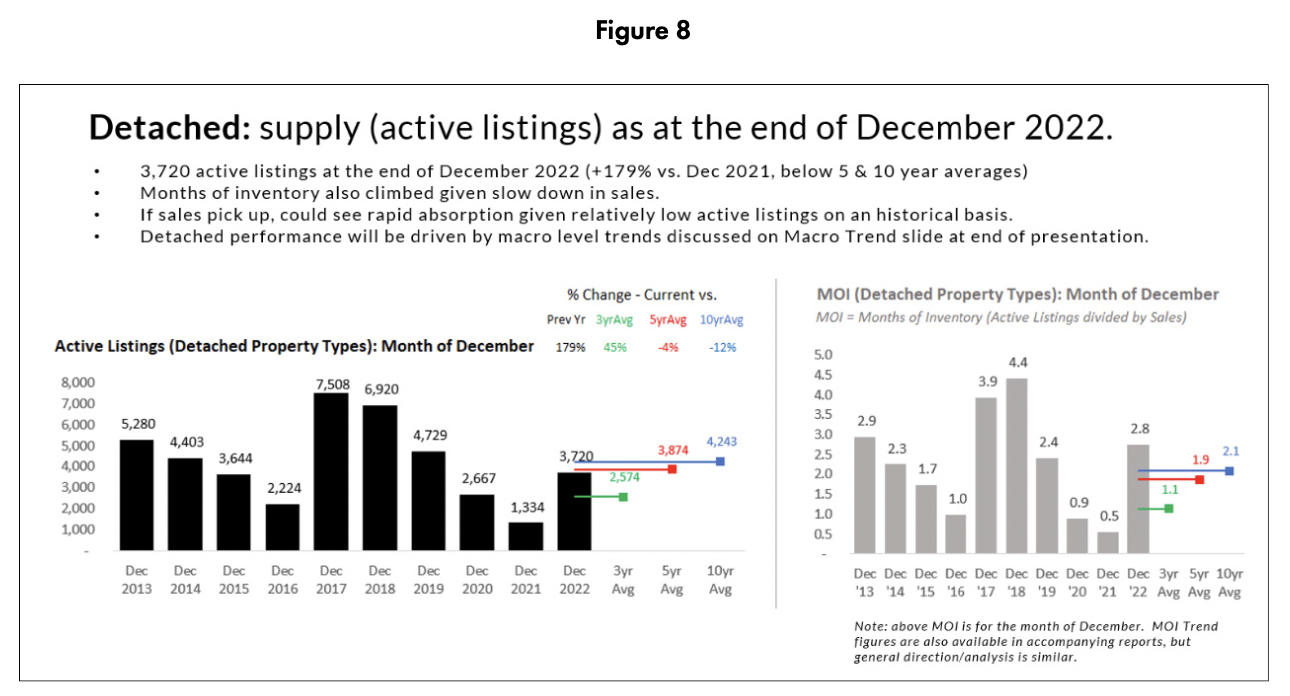
As illustrated in the below chart (Figure 8), at the end of December 2022, there were 3,720 detached properties available for sale across all TRREB regions. While this was up significantly from December 2021, it still remained below the five- and ten-year December average.
From a months of inventory (MOI) perspective, given the drop in sales, detached MOI climbed
to 2.8 in December 2022 (MOI trend figures as well as MOI vs. average price correlations are available on request). We believe that once interest rates plateau, and the economic fog starts to lift, sales volumes will increase and MOI conditions will start to tighten. This should keep detached prices relatively flat on a month-to-month (add the underline) basis over the near term, with possible upward price pressure by mid/ late 2023. (Note: year-over-year prices will look dismal during Q1/2023 as prices will be compared against the Q1/2022 peak).
Condo Supply – Active Listings Heading Into 2023
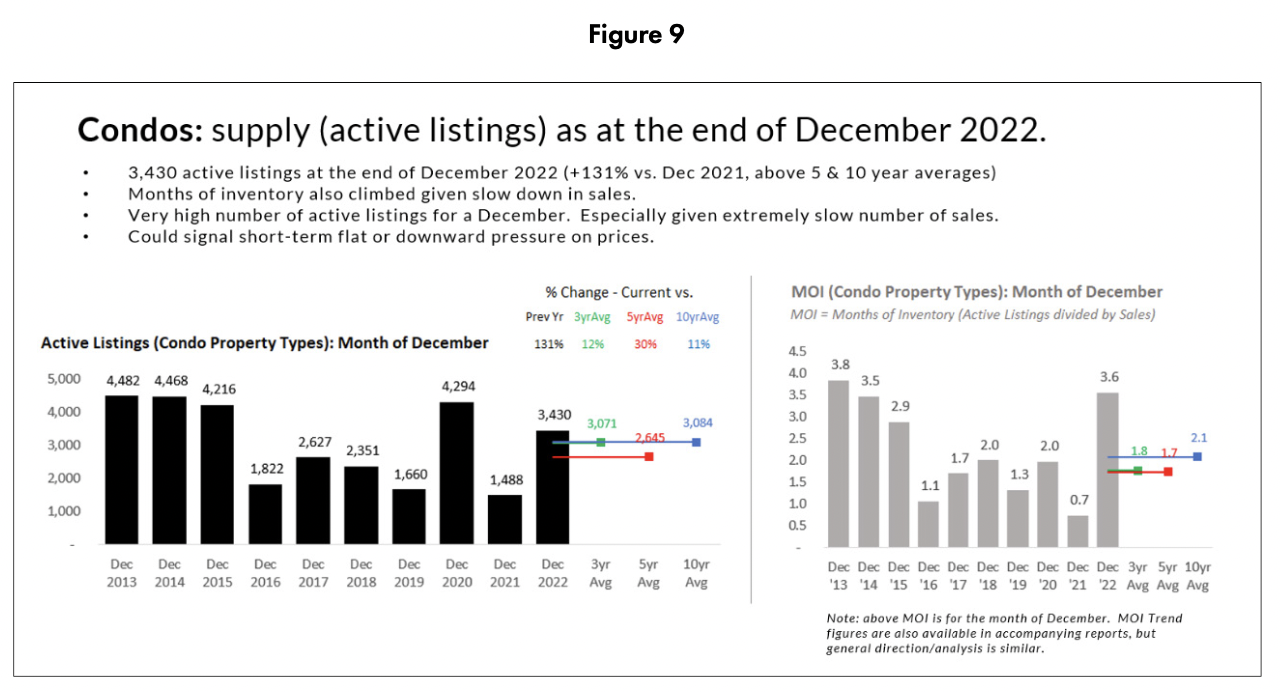
Shifting to condos, the number of condo active listings at the end of December 2022 was 3,430, also up significantly from December 2021 (1,488). On a historical basis, condo active listings were above the 3, 5, and 10 year averages and hit the highest point for a December since 2016 as illustrated in the below chart (Figure 9).
Given the pace of sales is at a 10 year low (and months of inventory is near a 10 year high at 3.6 months), condos could face flat or decreasing price pressure on a month-to-month basis over the near term, which could provide a potential buying opportunity for investors or those looking to enter the market. However, any headwinds are anticipated to be for the short term as condos have a significant number of med/long term tailwinds as outlined on the next page.
Condos - Tailwinds / Headwinds
- Immigration. We welcomed 431,000 new permanent residents to Canada in 2022 and that number is expected to grow to 500,000 by 2025.
- Affordability. As condos have a lower average price than other property types, they are the entry point for many buyers, resulting in a steady flow of demand.
- Rental Market. From an investor perspective, condo rents have increased significantly, which helps to offset the higher interest rate costs. December 2022 average condo rents ($2,740/mth) across the GTA were up 14.9% vs. December 2021 ($2,016/mth).
Short Term Headwinds:
- Entering 2023 with a relatively high inventory (active listings).
- Potential for additional supply from investors if they decide to sell their units, given the increased carrying costs as a result of higher interest rates.
- Additional inventory that could come from a record year of new condo completions. In fact, 32,000 newly built condos are expected to register in 2023, surpassing the previous record of 22,000 in 2020. Given the majority of these new construction condos were purchased by investors when interest rates were much lower, many of these units could hit the resale market shortly after registering, or end up in the rental market for a short term, and then potentially be sold in 2024.
Macro Level Topics With BIG Impact Potential on 2023 Housing
To close out this report, we have listed some of the macro level topics that we’re monitoring as we progress through 2023 as they could have an oversized impact on housing results.
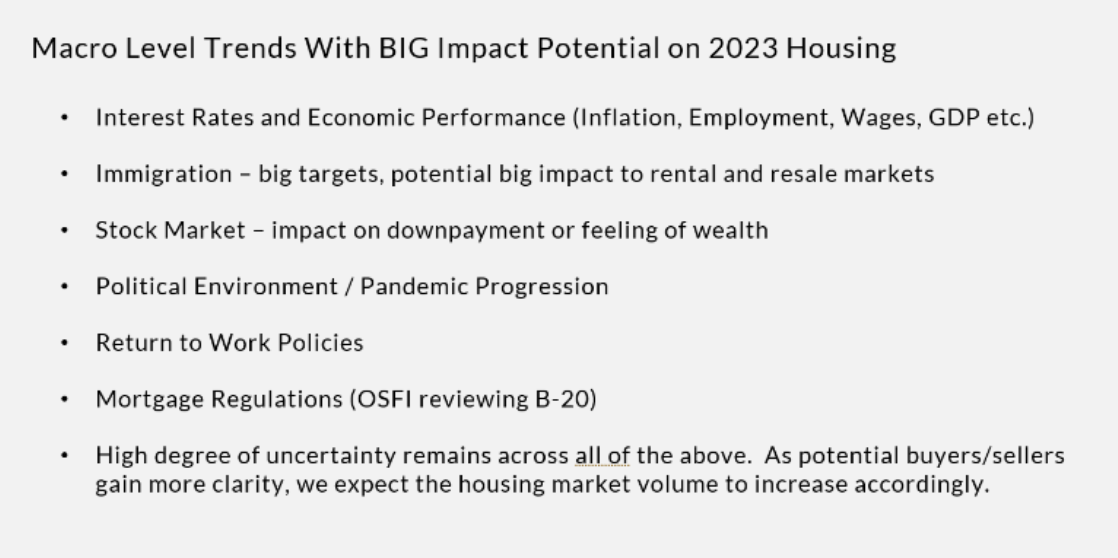
1 – Interest rates. We anticipate one final 0.25% increase by the Bank of Canada (BoC) at either their January 25th or March 8th meeting. Following the increase, we expect the BoC will pause until either December 2023 or early 2024 when they will start to unwind some of the increases they put in place during 2022. For more information on our outlook, please refer to our full year mortgage outline report.
2 – Immigration. Big targets and big potential for housing from both a resale and rental market perspective.
3 – The stock market. 2022 was a tough time for those invested in the stock market. Many people may have lost some of their down payment savings and felt less wealthy than they did in 2021. If the stock market turns around in 2023, it could help drive more activity into the housing market.
4 – Ongoing risks given the current political environment and the ongoing pandemic progression. 5 – Return to work policies. As return to work policies evolve, it could have a significant impact on sales patterns between the 416, 905, and various neighbourhoods and property types.
6 – Mortgage Regulations. OSFI recently announced that they are reviewing mortgage policies for potential further tightening measures. For more on this, please refer to our full year mortgage outline report.
Overall, a significant amount of uncertainty remains across many aspects of the GTA real estate market as we enter 2023. We believe that as buyers and sellers gain more clarity on even some of the above items, it will create more confidence in the market and volumes will begin to increase. Depending on the timing of this increase, the price trajectory could vary significantly, however, the first step will be getting people back into the market.
Outline Financial
Outline Financial is one of Canada’s top-rated mortgage and insurance companies offering direct access to rate and product options from over 30 banks, credit unions, mono-line lenders and insurers all in one convenient service. The Outline team was formed by senior level bankers and financial planners that wanted to offer clients choice with an exceptional service experience.
Contact
Tel: (416) 536-9559
Email: hello@outline.ca
Click here to book a call
Outline Financial – Toronto Head Office
465 King Street East – Suite 15
Toronto, ON M5A 1L6
Outline Financial – Toronto
326 Carlaw Ave – Suite 103
Toronto, ON M4M 2R6
Outline Financial – Ottawa
90 Richmond Rd – Suite H
Ottawa, ON K1Z 6V9
Outline Financial – Calgary
330 – 5th Avenue SW, Tower 1, Suite 1800
Calgary, AB T2P 0L4
Outline Financial – Vancouver
701 West Georgia St, Suite 1500
Vancouver, BC Y7Y 1C6
Legal
FSRA Mortgage Brokerage Licence #13151
FSRA Life Insurance and Accident and Sickness Insurance Agent License #36641M


